MongoDB Instances Overview
Provides a high-level view of all MongoDB deployments monitored by PMM, including sharded clusters, replica sets, and standalone instances.
Use this dashboard as your starting point for MongoDB monitoring to quickly assess overall health before drilling down into specific instances.
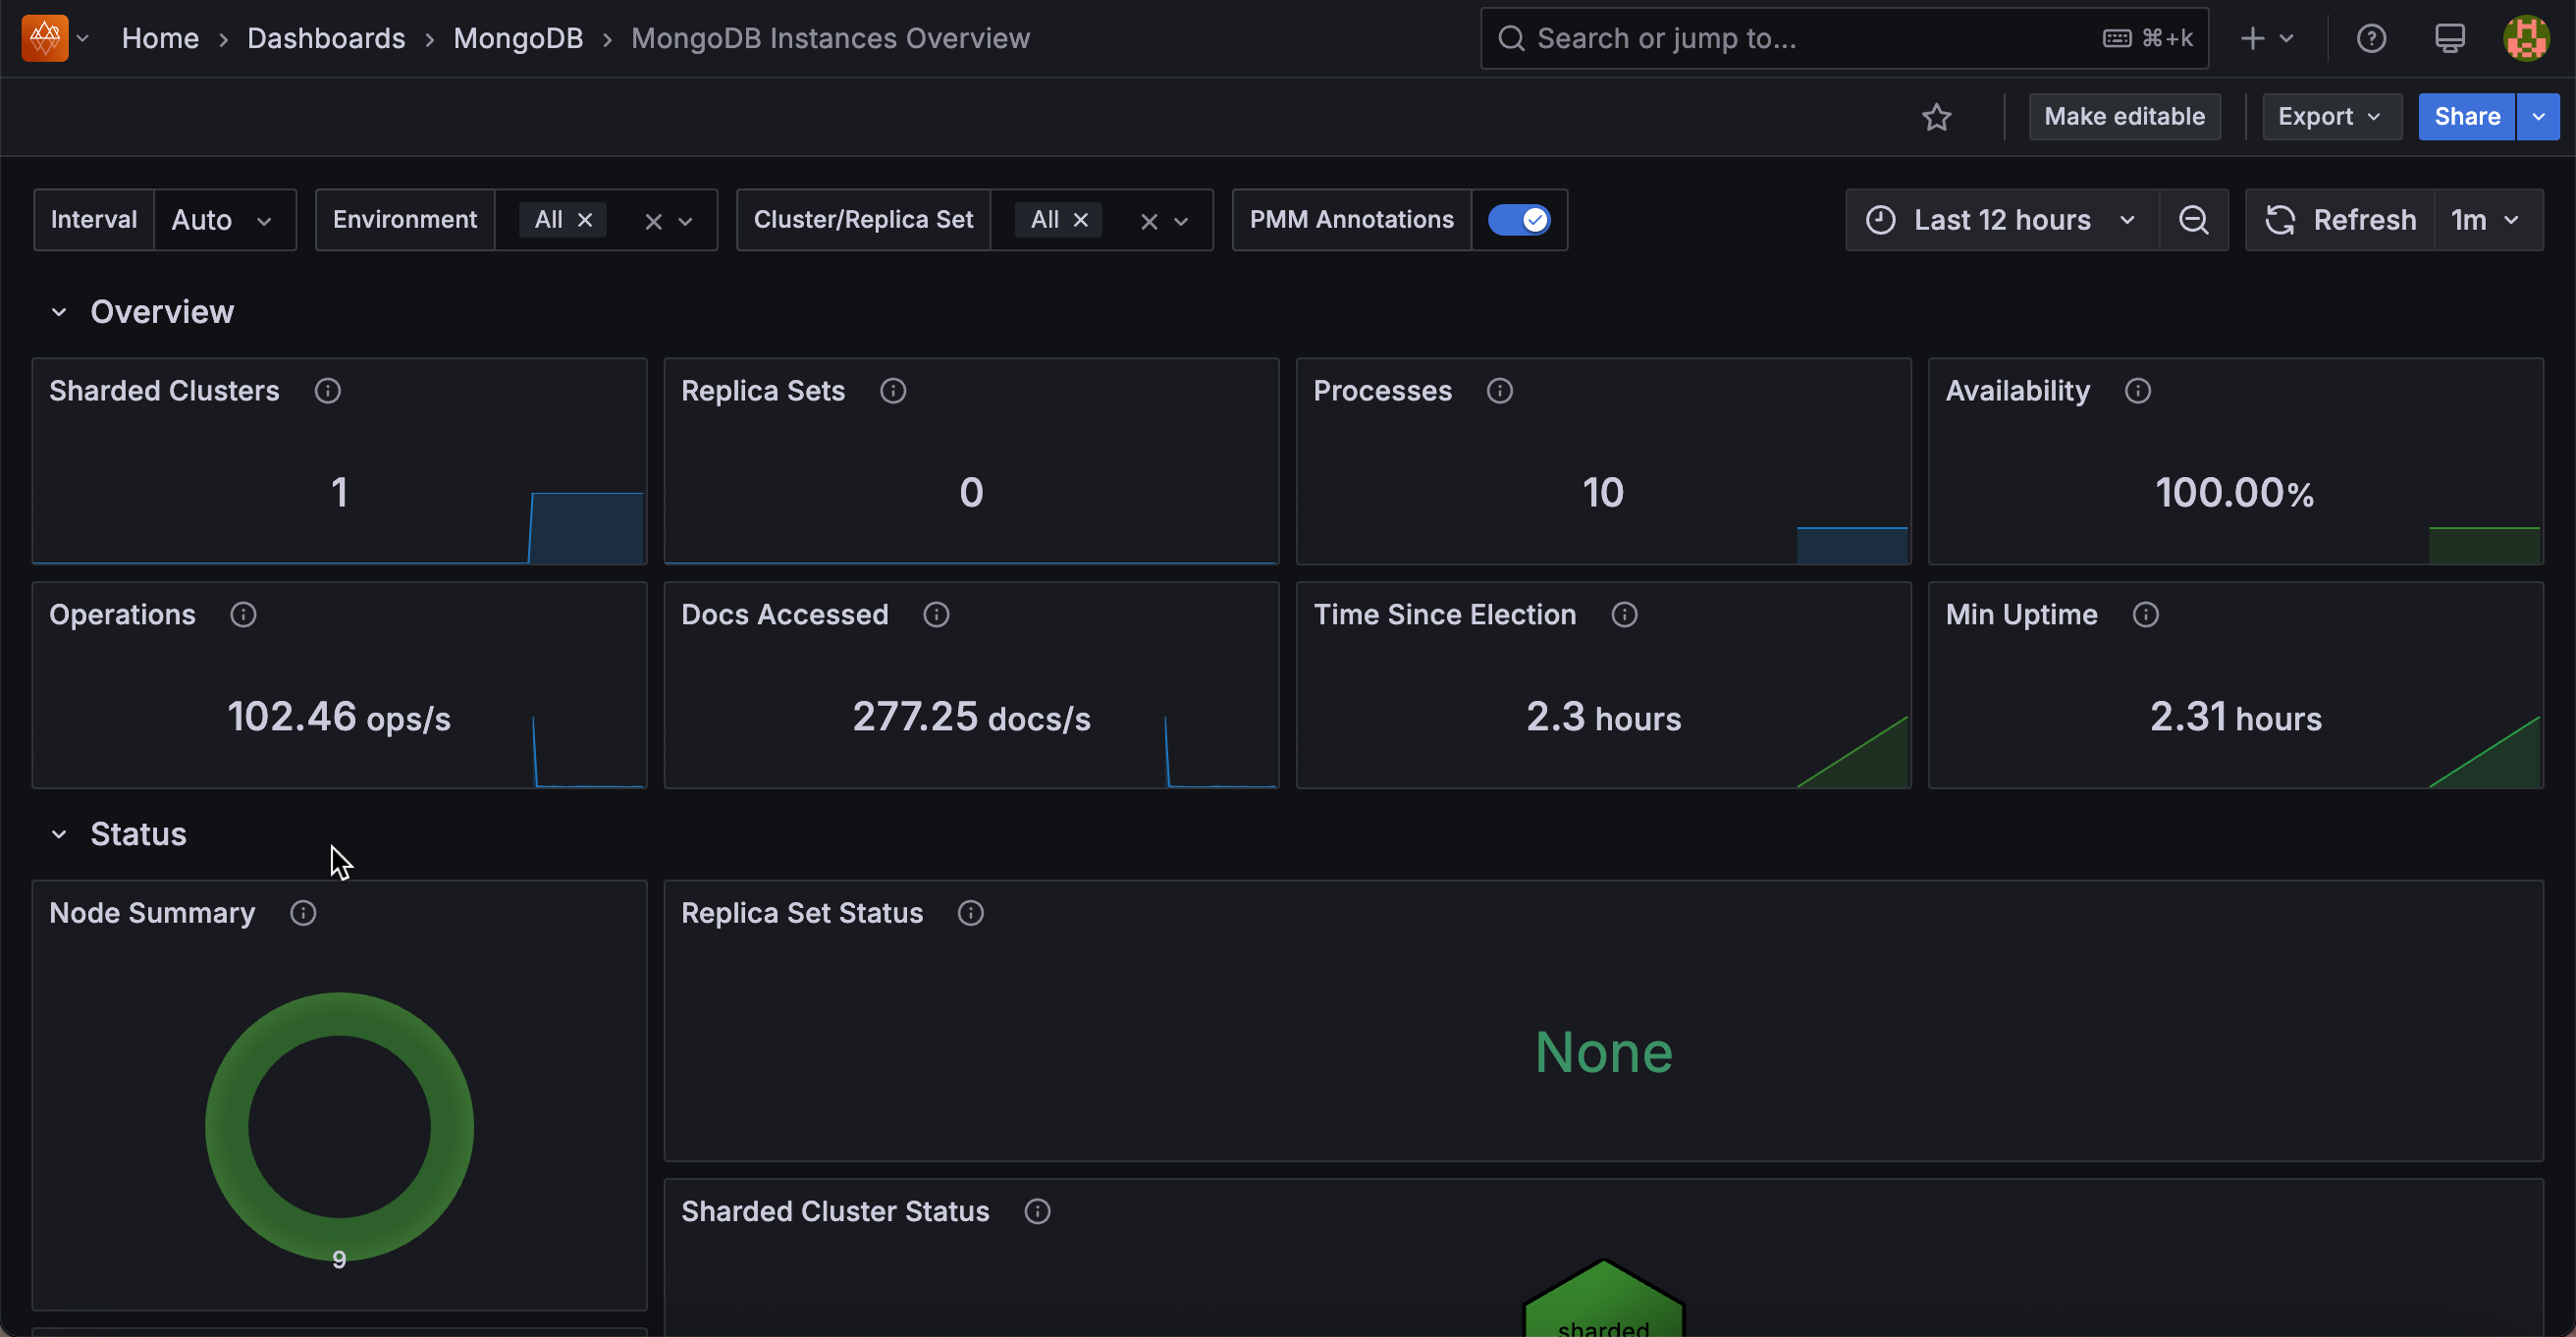
Overview
Sharded Clusters
Displays the total number of sharded clusters currently being monitored by PMM.
Replica Sets
Shows the count of replica sets that are not part of a sharded cluster. This helps you understand your standalone replica set deployment scope.
Processes
Displays the total number of MongoDB processes (mongod + mongos) being monitored across all environments and clusters.
Availability
Shows the percentage of time each cluster or replica set had a primary node available during the selected time range.
Color-coded thresholds help identify availability concerns: red indicates low availability, yellow shows moderate availability, and green confirms healthy uptime.
Operations
Displays the total rate of read/write operations per second across selected instances, excluding administrative commands.
Docs Accessed
Shows the rate of documents being inserted, updated, deleted, or returned per second across selected instances.
Time Since Election
Displays how long ago the most recent replica set election occurred.
Color-coded to highlight recent elections: red (less than 5 minutes), yellow (5-60 minutes), and green (over 1 hour). Frequent elections may indicate cluster instability.
Min Uptime
Shows the minimum uptime among all monitored MongoDB processes. This helps quickly identify recently restarted nodes that may need attention.
Status
Node Summary
A donut chart showing the count of mongod nodes grouped by health status. Green represents nodes in healthy states (PRIMARY, SECONDARY, ARBITER), while red flags nodes requiring attention.
Replica Set Status
A hexagon grid displaying each replica set’s health status.
Each hexagon represents a replica set and is color-coded: green for OK, red for CHECK.
Click any hexagon to open the Replica Set Summary dashboard for detailed monitoring.
Sharded Cluster Status
A hexagon grid showing the health of each sharded cluster. Click any cluster hexagon to navigate to its Sharded Cluster Summary dashboard for detailed metrics.
Router Status
A hexagon grid displaying individual MongoS router status. Each hexagon represents a router and shows OK (green) or CHECK (red). Click any router to open its Router Summary dashboard.
Router Summary
A donut chart showing the count of MongoS routers registered with PMM Server, grouped by status. Green (OK) indicates routers that are up and operational, while red (CHECK) flags routers that are down or unreachable.
Connections Detail
Top 5 Connections
Shows a time series of the five services with the highest TCP connection counts, plus the overall average.
Current Connections
The Current Connections hexagon grid displays the current connection count for each service.
Click any hexagon to drill down to that instance’s summary.
Opcounters Detail
Top 5 Command Operations/Command Operations
Shows the rate of administrative commands processed per second. The Top 5 panel displays a time series of the busiest services, while the hexagon grid shows all services at a glance.
Top 5 Getmore Operations/Getmore Operations
Tracks requests to fetch more results from a query cursor, such as when iterating through large result sets.
Useful for identifying services with heavy cursor activity.
Top 5 Delete Operations/Delete Operations
Displays the rate of delete commands per second across your MongoDB instances.
Top 5 Insert Operations/Insert Operations
Shows the rate of insert commands per second, helping you identify write-heavy services.
Top 5 Update Operations/Update Operations
Displays the rate of update commands per second across monitored instances.
Top 5 Query Operations/Query Operations
Shows the rate of query/find operations per second, helping identify read-heavy services.
Document Operations Detail
Top 5 Document Delete/Insert/Return/Update Operations
Track the actual number of documents affected by operations, as opposed to the command count.
A single update command, for example, could affect hundreds of documents.
High values may indicate queries operating on more documents than expected.
Queued Operations Detail
Top 5 Queued Read Operations/Queued Read Operations
Shows read operations waiting for a lock.
Consistently small values are normal, but persistently high values indicate queries causing long lock times that should be investigated.
Top 5 Queued Write Operations/Queued Write Operations
Displays write operations waiting for a lock. High values may indicate write contention that could impact performance.