MongoDB Instance Summary
Provides detailed metrics for a single MongoDB instance, including performance, operations, and system resource usage.
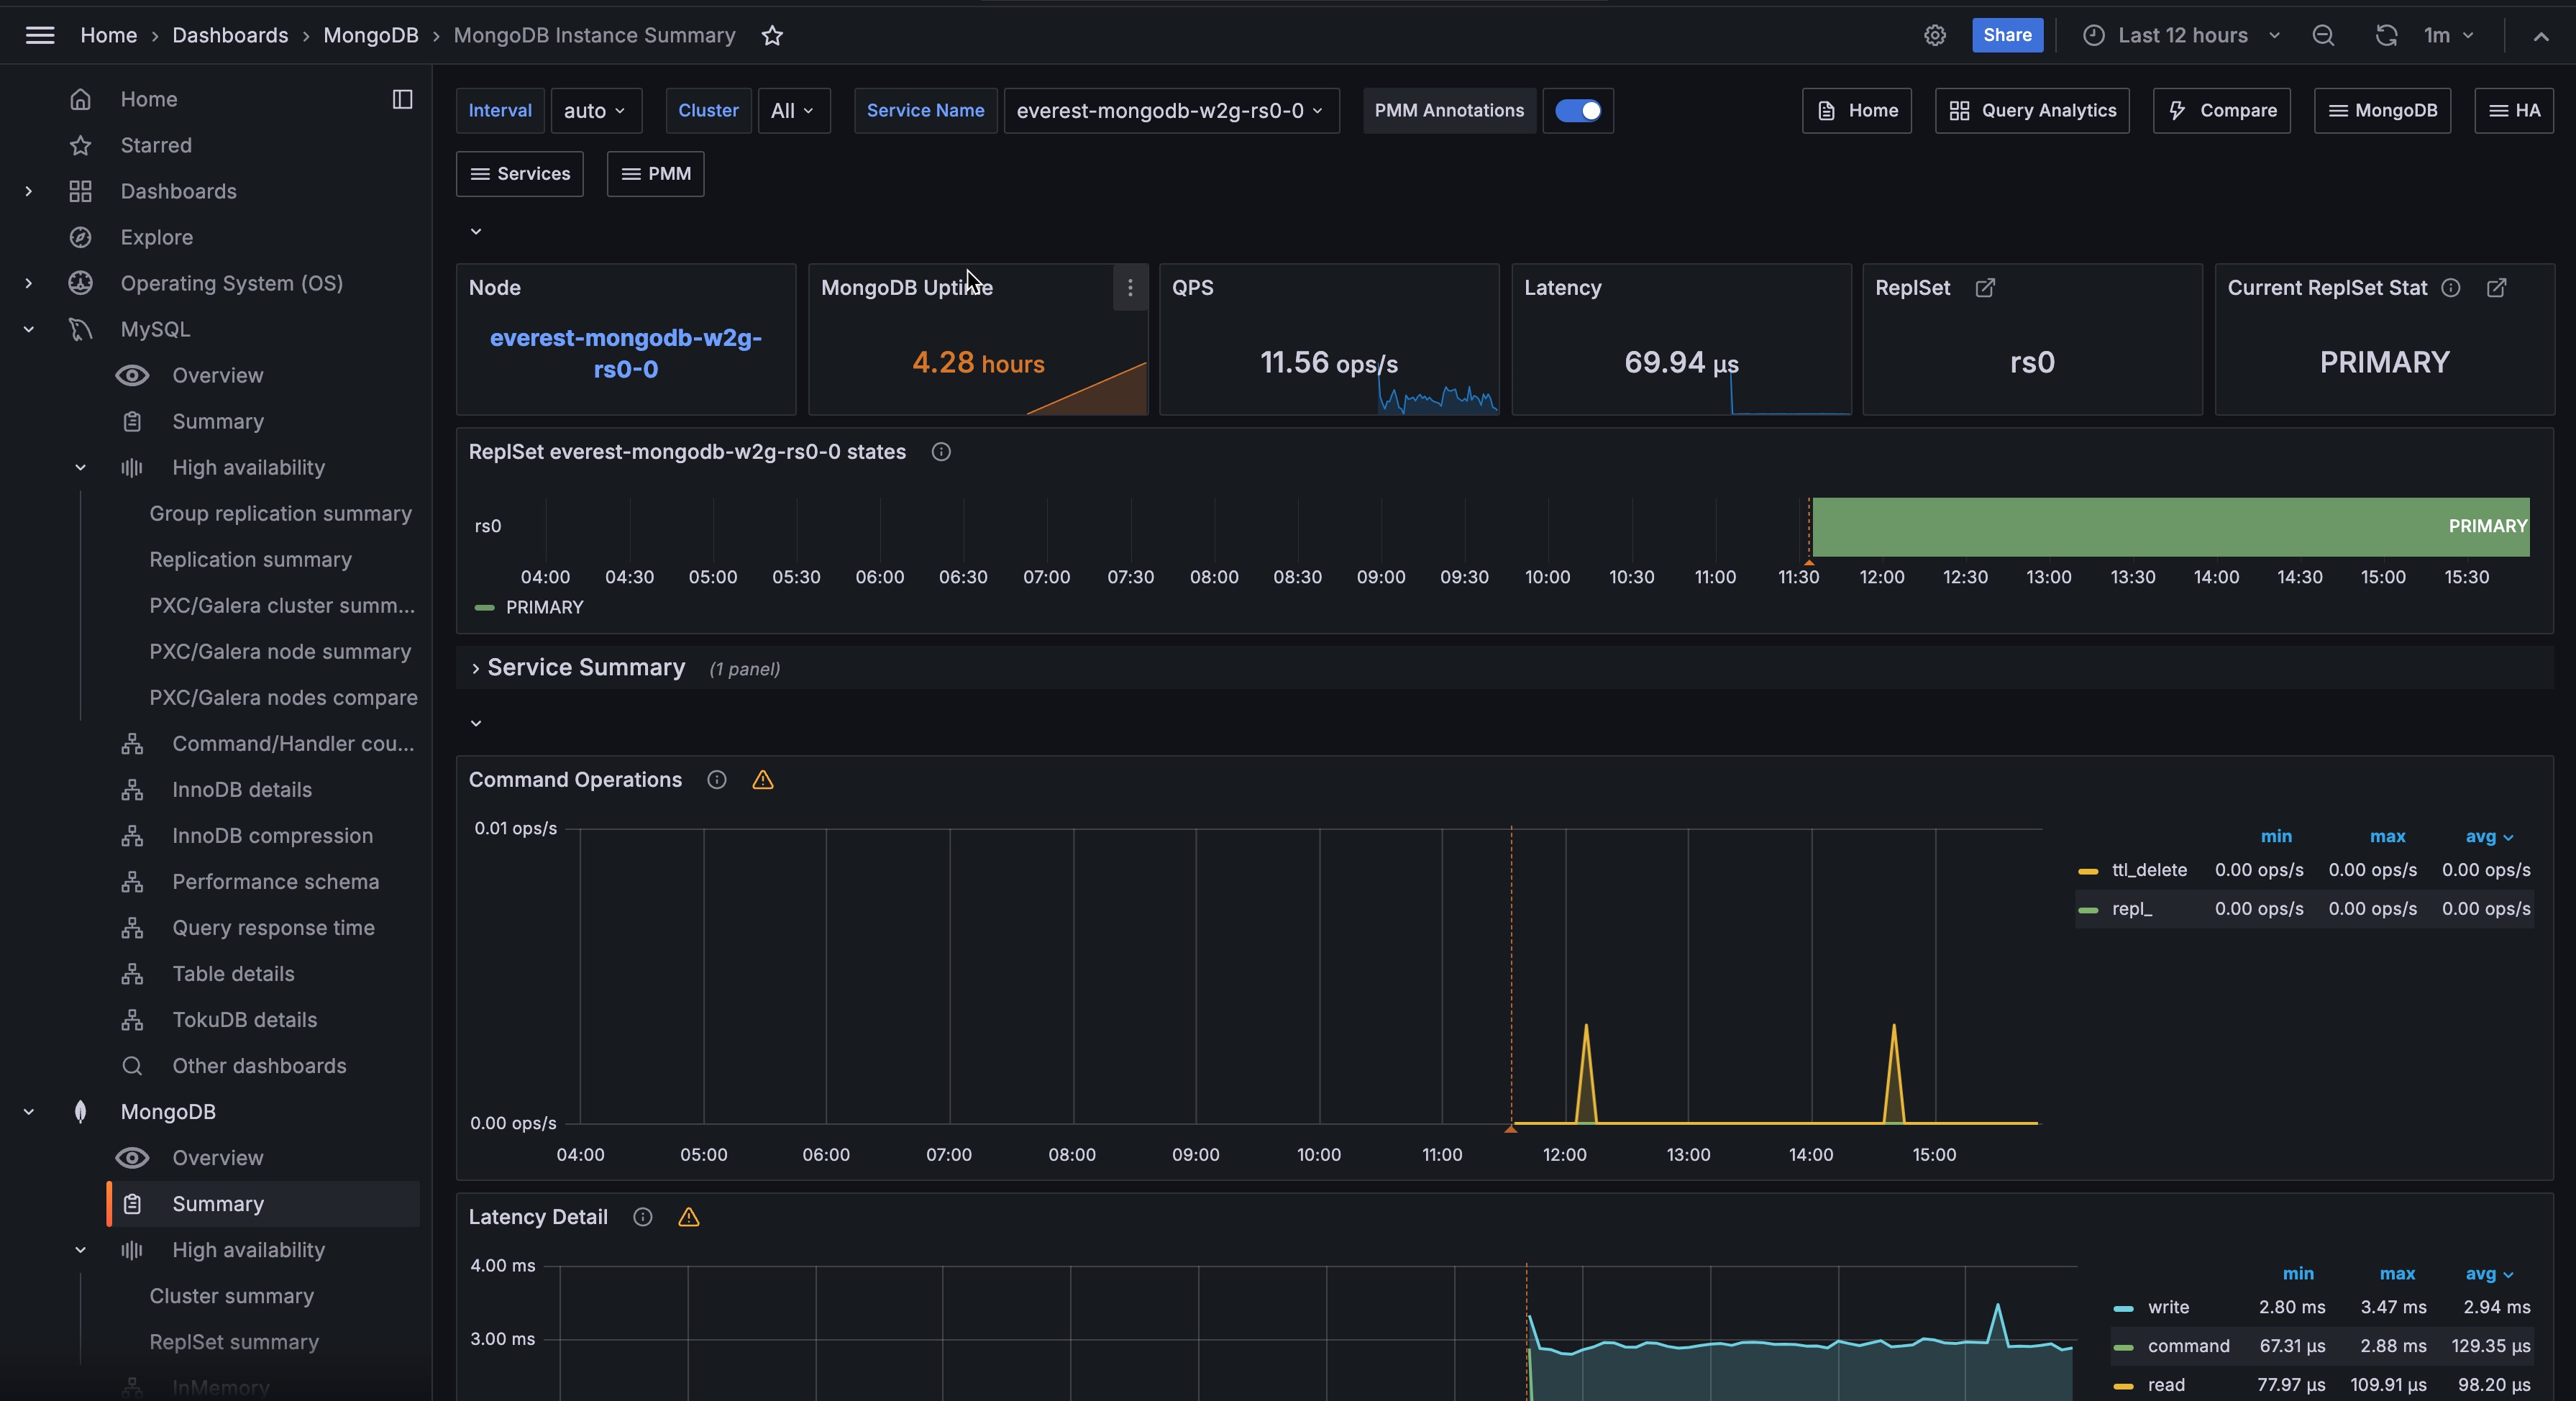
Overview
At the top of the dashboard, summary panels show key metrics at a glance:
- Node: Link to the Node Summary dashboard for the underlying host.
- MongoDB Uptime: How long the MongoDB instance has been running. Color-coded:
- Red: less than 1 hour
- Yellow: 1–24 hours
- Green: more than 24 hours
- QPS: Queries per second, excluding administrative commands.
- Latency: Average command latency in microseconds.
- ReplSet: Name of the replica set the instance belongs to.
- Current ReplSet State: Current role of the instance, such as PRIMARY, SECONDARY, ARBITER, or transitional states like STARTUP2 during initial sync.
ReplSet States
A timeline showing replica set state changes over time. Useful for identifying elections, failovers, or role changes. See Replica Set Member States for more details.
Service Summary
Detailed summary information for the selected MongoDB service.
Command Operations
Operations per second by type, including replicated operations (repl_insert, repl_update, repl_delete) and TTL index deletions (ttl_delete). Also shows legacy wire protocol operations (query, insert, update, delete, getmore).
Latency Detail
Average latency of operations classified by type: read, write, or command.
Connections
Current TCP connections to the MongoDB instance.
Cursors
Open cursors, including idle cursors. High cursor counts may indicate applications not properly closing cursors.
Document Operations
Documents per second inserted, updated, deleted, or returned. Note that document counts don’t map 1-to-1 with operation counts—a single update operation can affect multiple documents.
Queued Operations
Operations waiting due to a lock. Consistently high values indicate lock contention that may need investigation.
Query Efficiency
Ratio of documents returned (or index entries scanned) to full documents scanned. Low ratios may indicate missing indexes or inefficient queries.
Scanned and Moved Objects
Number of data objects (scanned_objects) and index entries (scanned) examined, plus documents moved due to growth. Moved documents only apply to the legacy MMAPv1 storage engine.
getLastError Write Time
Legacy driver metric: time spent executing getLastError commands to confirm write concern.
getLastError Write Operations
Legacy driver metric: count of getLastError commands, including those that timed out.
Assert Events
Assert events per second. Occasional asserts are normal, but spikes or consistently high values warrant checking log files.
Page Faults
Operating system memory page faults. These are system-level faults, not necessarily caused by MongoDB.
System Resources
The lower section shows host-level metrics:
- System Uptime: How long the host has been running.
- Load Average: One-minute load average.
- RAM: Total physical memory.
- Memory Available: Percentage of memory available for applications.
- Virtual Memory: Total memory including RAM and swap space.
- Disk Space: Total disk space across all partitions.
- Min Space Available: Lowest available disk space percentage across partitions.
CPU Usage
CPU time breakdown by mode (user, system, iowait, etc.) as a percentage of total capacity.
CPU Saturation and Max Core Usage
Shows normalized CPU load and maximum core utilization. High saturation indicates processes waiting for CPU time.
Disk I/O and Swap Activity
Disk read/write rates and swap activity. High swap activity may indicate memory pressure.
Network Traffic
Inbound and outbound network traffic in bytes per second.